A Beautiful View – Sensex Stock Market Returns over the Long Term
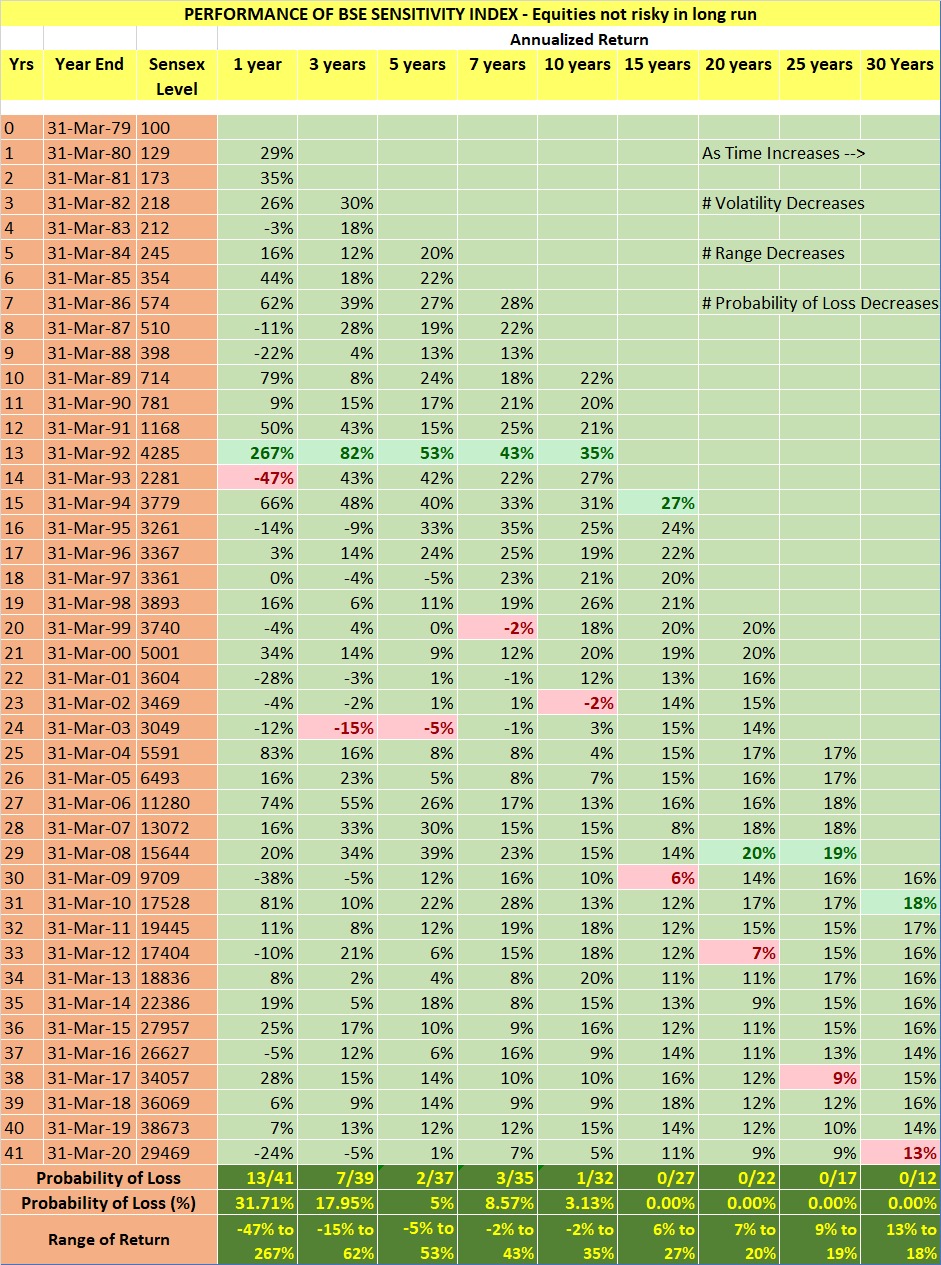
Someone sent me this beautiful Sensex chart a couple of days back. The chart shows how the stock market returns look like over short and long periods of investment.
There is not a single 15 year period where the market return has been negative.
Since the beginning of time, when Sensex was born (1979), pick any 7-year period, you will notice that there are only 3 instances when the return was negative.
Extend that time period to 10 years, and the number of instances of negative return reduces to one. Extend the time period to 15, 20, 25, and 30 years, and you will see there is not a single instance of negative return!
Let me explain how to read the chart below.
The 2nd and the 3rd columns show the Sensex level on March 31st for all years since 1979.
Next Column shows the 1-year return for each 1-year period. For example, if you invested in 1979, your return at the end of the year would have been 29%. Had you invested in 1980, your 1-year return would have been 35%, and so on.
The subsequent columns show the returns for each 3, 5, 7, 10, 15,20, 25 and 30 year periods. If you had invested in 1979, your 30 year return would have been 16%. If you had invested in 1980, your 30-year return would have been 18%.
Note that these are annualized returns considering a one-time investment at the beginning of the fiscal year.
Buy Similar NIFTY Chart - Just Rs. 95! | Buy 3709 Companies Data - Just Rs. 485!

Buy Similar NIFTY Chart - Just Rs. 95! | Buy 3709 Companies Data - Just Rs. 485!
Let’s start with the ‘1 Year’ column.
Notice the return of 267% during the 13th year? That is the highest ever annual return. The next year, it returned a negative 48% (red font, highlighted in yellow). This is the worst one year return. You will also notice that there are 13 years out of 41 years when Sensex lost money. That is a 32% probability of losing money on annual gains (losses).
Let’s fast forward to the column ’10 Years’. Notice how the best period have a return of 35% and the worst period lost 2%.
Next, look at the ’15 Year’ column. You will notice that the Sensex has gained in each and every period. More importantly, the gain has beaten the average inflation almost always.
Important takeaways are –
- Long term investors have been rewarded well.
- As the investment duration increases, the volatility and the range of return decreases.
- As the investment duration increases, the probability of loss decreases.
- In the long term, Sensex has beaten inflation hands down.
If this chart doesn’t convince a person about the long term risk and reward, nothing else will.
If we extend this logic and apply it to a basket of blue chips, the returns may be possibly higher.
Now is an excellent time to identify good companies and start building a solid portfolio.
In my book, ‘Stock Picking Made Easy’, you will find a simple strategy to identify great companies at reasonable valuations in the Indian Stock Exchange.
Identifying great companies at the right time is the key to long term wealth creation.

Very useful information.But can you please explain how you have arrived at the ROI.We find some difference.Let us take for 30 years.ROI in 2009 is shown at 16.48%.But if we add one year return from 1979 to 2009 and divide by 30,we are getting 25.38%.
That’s CAGR not absolute return
Hi Prakash, good question.
ROI is same as CAGR – compounded annual growth rate. It is calculated using the RATE formula in excel. Let’s take the 1st 30 years. If one bought sensex at 100, and sold at 9708 at the end of the 30th year, the CAGR comes to 16.48%.
Similarly, from 2nd year to 31st year, the CAGR comes to 17.8%.
For the 2nd 30-year period, plug in the following in the RATE formula =RATE(30,,-128.57,17527) will result to 17.8%.
Hope this explains it.
What is the CAGR of Sensex since inception till date?
15%
Sensex Percentage
Average 40 years 8122.73 23.95 (Actually it is not 23.95% compound interest is only 15.6%)
Average 30 years 10733.20 25.28 (Actually it is not 25.28% compound interest is only 13.6%)
Average 20 years 14755.30 16.46 (Actually it is not 16.46% compound interest is only 11.5%)
Average 15 years 18353.47 22.06 (Actually it is not 22.06% compound interest is only 15.6%)
Average 10 years 21894.70 10.13 (Actually it is not 10.13% compound interest is only 13%)
Average 5 years 26857.20 15.76 (Actually it is not 15.76% compound interest is only 9.5%)
I have caluclated average Sensex for each year with Percentage, for 40 years average percentage increase in Sensex is 23 % where as Compound percentage is only 15.6%, where as for last year average percentage increase is 15.76% where as Compound increase is only 9.5%
You cannot use an average. Annualized rate of return would be equal to the compounded value. This mean if you had invested for years the cagr would be returns per year for x years.
Very useful information Mr.Radjeshbabu. Can you Please explain how to calculate market rate of return